Theming Altair
Summary
If you use Altair for visualizations, you can define a custom theme to adjust the look of your visualization to match streamlit's theme.
Streamlit Altair Theme
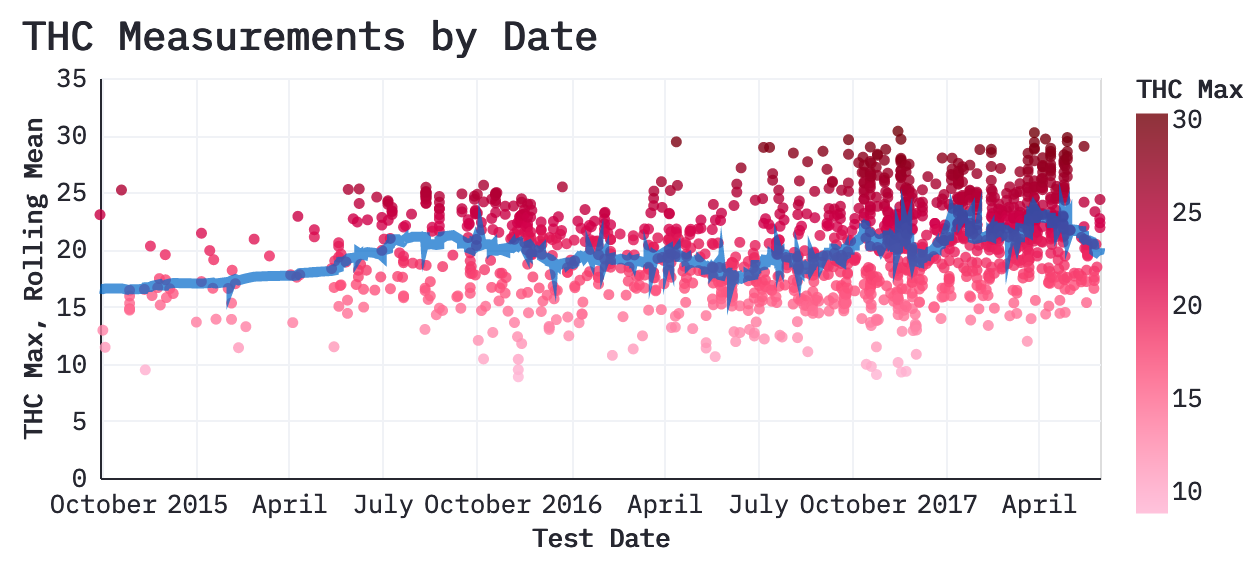
The python code below will apply a theme to your Altair visualizations that by default should match streamlit's theme settings. The default single color scale uses gradation of the primary color and was built with the Chroma.js Color Palette Helper. The divergent scale uses the primary color and the blue from the secondary colors. The categorical palette is a 5-color palette with the primary color, light-yellow secondary color, and remaining colors from the secondary palette.
The theme also adjusts the font to IBM Plex Mono to match data in dataframes and tables. It also adjusts the font sizes so that labels match the size of table elements and the chart title is the same size as an <h3> (header 3) element.
Example

Theme Code
def streamlit_theme():
    font = "IBM Plex Mono"
    primary_color = "#F63366"
    font_color = "#262730"
    grey_color = "#f0f2f6"
    base_size = 16
    lg_font = base_size * 1.25
    sm_font = base_size * 0.8  # st.table size
    xl_font = base_size * 1.75

    config = {
        "config": {
            "arc": {"fill": primary_color},
            "area": {"fill": primary_color},
            "circle": {"fill": primary_color, "stroke": font_color, "strokeWidth": 0.5},
            "line": {"stroke": primary_color},
            "path": {"stroke": primary_color},
            "point": {"stroke": primary_color},
            "rect": {"fill": primary_color},
            "shape": {"stroke": primary_color},
            "symbol": {"fill": primary_color},
            "title": {
                "font": font,
                "color": font_color,
                "fontSize": lg_font,
                "anchor": "start",
            },
            "axis": {
                "titleFont": font,
                "titleColor": font_color,
                "titleFontSize": sm_font,
                "labelFont": font,
                "labelColor": font_color,
                "labelFontSize": sm_font,
                "gridColor": grey_color,
                "domainColor": font_color,
                "tickColor": "#fff",
            },
            "header": {
                "labelFont": font,
                "titleFont": font,
                "labelFontSize": base_size,
                "titleFontSize": base_size,
            },
            "legend": {
                "titleFont": font,
                "titleColor": font_color,
                "titleFontSize": sm_font,
                "labelFont": font,
                "labelColor": font_color,
                "labelFontSize": sm_font,
            },
            "range": {
                "category": ["#f63366", "#fffd80", "#0068c9", "#ff2b2b", "#09ab3b"],
                "diverging": [
                    "#850018",
                    "#cd1549",
                    "#f6618d",
                    "#fbafc4",
                    "#f5f5f5",
                    "#93c5fe",
                    "#5091e6",
                    "#1d5ebd",
                    "#002f84",
                ],
                "heatmap": [
                    "#ffb5d4",
                    "#ff97b8",
                    "#ff7499",
                    "#fc4c78",
                    "#ec245f",
                    "#d2004b",
                    "#b10034",
                    "#91001f",
                    "#720008",
                ],
                "ramp": [
                    "#ffb5d4",
                    "#ff97b8",
                    "#ff7499",
                    "#fc4c78",
                    "#ec245f",
                    "#d2004b",
                    "#b10034",
                    "#91001f",
                    "#720008",
                ],
                "ordinal": [
                    "#ffb5d4",
                    "#ff97b8",
                    "#ff7499",
                    "#fc4c78",
                    "#ec245f",
                    "#d2004b",
                    "#b10034",
                    "#91001f",
                    "#720008",
                ],
            },
        }
    }
    return config
Applying the Theme
After you define this function, you'll need to register the theme with Altair wherever you define your plots.
alt.themes.register("streamlit", streamlit_theme)
alt.themes.enable("streamlit")
Alternative Theme
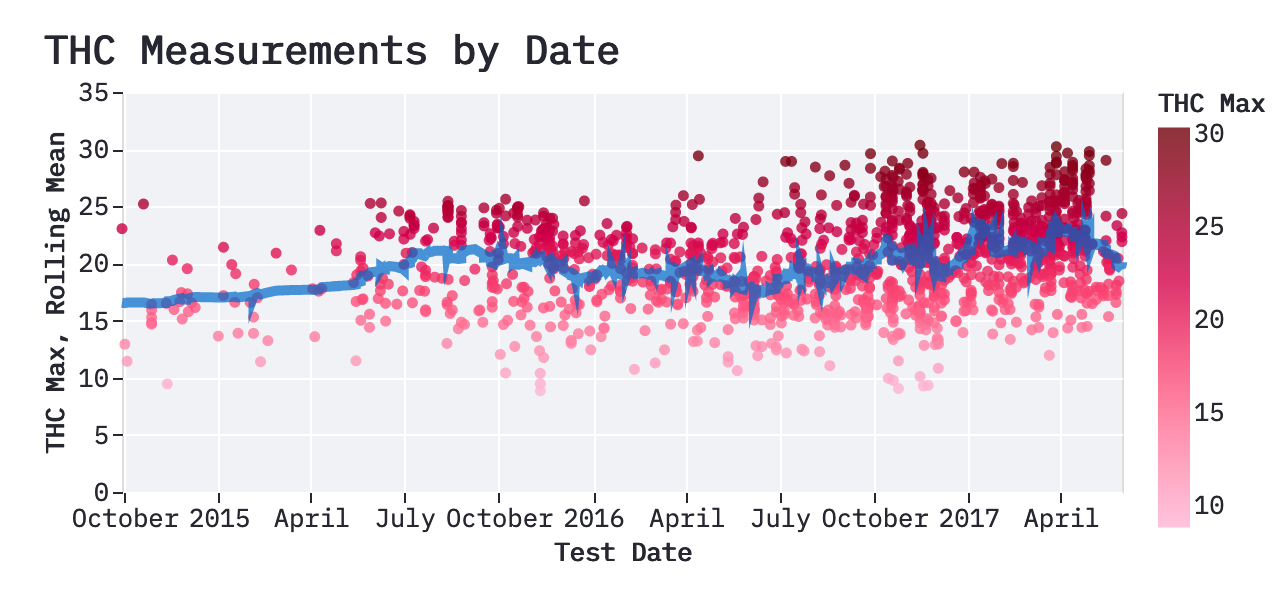
This alternative theme is closer to the default theme in ggplot2. It adds a grey background, changes the grid to white, and removes some of the dark plot spine.
Example

Theme Code
def streamlit_theme_alt():
    font = "IBM Plex Mono"
    primary_color = "#F63366"
    font_color = "#262730"
    grey_color = "#f0f2f6"
    base_size = 16
    lg_font = base_size * 1.25
    sm_font = base_size * 0.8  # st.table size
    xl_font = base_size * 1.75

    config = {
        "config": {
            "view": {"fill": grey_color},
            "arc": {"fill": primary_color},
            "area": {"fill": primary_color},
            "circle": {"fill": primary_color, "stroke": font_color, "strokeWidth": 0.5},
            "line": {"stroke": primary_color},
            "path": {"stroke": primary_color},
            "point": {"stroke": primary_color},
            "rect": {"fill": primary_color},
            "shape": {"stroke": primary_color},
            "symbol": {"fill": primary_color},
            "title": {
                "font": font,
                "color": font_color,
                "fontSize": lg_font,
                "anchor": "start",
            },
            "axis": {
                "titleFont": font,
                "titleColor": font_color,
                "titleFontSize": sm_font,
                "labelFont": font,
                "labelColor": font_color,
                "labelFontSize": sm_font,
                "grid": True,
                "gridColor": "#fff",
                "gridOpacity": 1,
                "domain": False,
                # "domainColor": font_color,
                "tickColor": font_color,
            },
            "header": {
                "labelFont": font,
                "titleFont": font,
                "labelFontSize": base_size,
                "titleFontSize": base_size,
            },
            "legend": {
                "titleFont": font,
                "titleColor": font_color,
                "titleFontSize": sm_font,
                "labelFont": font,
                "labelColor": font_color,
                "labelFontSize": sm_font,
            },
            "range": {
                "category": ["#f63366", "#fffd80", "#0068c9", "#ff2b2b", "#09ab3b"],
                "diverging": [
                    "#850018",
                    "#cd1549",
                    "#f6618d",
                    "#fbafc4",
                    "#f5f5f5",
                    "#93c5fe",
                    "#5091e6",
                    "#1d5ebd",
                    "#002f84",
                ],
                "heatmap": [
                    "#ffb5d4",
                    "#ff97b8",
                    "#ff7499",
                    "#fc4c78",
                    "#ec245f",
                    "#d2004b",
                    "#b10034",
                    "#91001f",
                    "#720008",
                ],
                "ramp": [
                    "#ffb5d4",
                    "#ff97b8",
                    "#ff7499",
                    "#fc4c78",
                    "#ec245f",
                    "#d2004b",
                    "#b10034",
                    "#91001f",
                    "#720008",
                ],
                "ordinal": [
                    "#ffb5d4",
                    "#ff97b8",
                    "#ff7499",
                    "#fc4c78",
                    "#ec245f",
                    "#d2004b",
                    "#b10034",
                    "#91001f",
                    "#720008",
                ],
            },
        }
    }
    return config
Again, be sure you register the theme after you define it. Note that this function is called streamlit_theme_alt.
Large Categorical Color Palette
The palette below may be helpful if you have more than 5 categories. It was generated by alternating colors on this divergent scale which uses some of the primary and secondary colors.
category_large = [
    "#f63366",
    "#0068c9",
    "#fffd80",
    "#7c61b0",
    "#ffd37b",
    "#ae5897",
    "#ffa774",
    "#d44a7e",
    "#fd756d",
]